1. Introduction
Currently Brazil is one of the largest producers and exporters of agricultural products in the world, participating actively in the international agrobusiness market in numerous products such as soybeans, corn, cotton, orange juice, cellulose, and animal proteins (Klein & Luna, 2023). Yet one product has never fully satisfied even local consumption despite its ever-growing importance in the national diet. Wheat and wheat flour have been imported since the early 19th century, and from then until today have represented Brazil largest agricultural import, accounting for 29% of all food imports in 20231. Wheat became increasingly consumed in Brazil after the late-19th century arrival of millions of Italian and Spanish immigrants, who were among the highest per capita consumers of wheat in Europe (Collins, 1993: 23). To satisfy this increasing demand, the various governments since the late 19th century have encouraged wheat production as much as possible. This has involved both costly market interventions which were later abandoned, and significant research investments in new seeds and methods of production to compensate for the relatively negative environment for production. Wheat is traditionally produced in northern or southern temperate climates, but rarely in semi-tropical and tropical regions like Brazil. Yet by 2023 Brazil was finally producing 56% of Argentine production2, the leading South American producer. It was also progressively moving toward self-sufficiency in the past few decades and even producing a modest level of exportations.
It is this complex history of wheat production in Brazil that we propose to examine in this essay. The methodology we use to analyze this history is based on a documentary and statistical review of wheat cultivation in Brazil from the colonial period to the present, with the objective of a long-term view that allows us to observe the distinctive stages of this crop. It uses a regional historical approach and has as key variables: the changes and alterations of the producing regions over time, the public policies involved in the production and commercialization of wheat, as well as the conditions of the international market of the product.
2. Historical Evolution
At the time of the Portuguese conquest of Brazil, the primary bread consumed by the mass of the Amerindian population was made from manioc flour. Manioc, which was first domesticated in the Amazonian region centuries before the arrival of the Portuguese, was consumed throughout South America, with evidence that it was used as early as 8,000 BPE in the eastern Andean foothills (Clement et al., 2010: 73-4). From its American origins it spread throughout the tropics and today is consumed daily by over 800,000 people throughout the world. While elite Europeans were accustomed to consuming wheat, the majority of the local colonial population, made up of African, Amerindian and European admixtures, consumed manioc as flour used with fish and vegetables as well as in cassava bread. Even today manioc is widely produced and consumed in Brazil, and is a staple in the North and Northeastern regions (Marchetti et al., 2013: 314; Souza et al., 2013: 193).
Originally domesticated in Southwest Asia, wheat was a traditional product in Europe at the time of the discoveries and, therefore, introduced in Brazil from the beginning of Brazilian colonization (Flandin & Montenari, 1998; Bartaburu, 2016). There are references to its production in the colony in the 16th century, planted to feed those Portuguese colonizers who were accustomed to this essential consumption in their diet (Carmo, 1911: chap. 1). In the province of São Paulo, since the 17th century there was a regular production of wheat. Already by 1614 there existed a flour mill in the village of São Paulo (Holanda, 1995: chap. 2). Apparently local production was sufficient for the local market and there was even excess capacity for export to other parts of the colony (Monteiro, 1994: 113-17). The temperate regions south of the province of São Paulo, which were only settled in the 18th century, became the prime region of production in the late colonial period (Jacobson, 2003: 14-5). The crown sponsored Azorean immigrants, who produced wheat along with other crops. Production expanded throughout the Rio Grande do Sul region, but never reached large dimensions (Varela, 1933, I: 191; Bartaburu, 2016: 90). Rust disease, Argentine competition (including via smuggling) and later the opening of the ports in 1808 were important factors in the significant decline of wheat growing in Brazil (Bartaburu, 2016: 90), but wheat never disappeared from Brazil. Saint-Hilaire, in his travels through Rio Grande do Sul identified the cultivation of the product along his journey. He also presented a series of data on exports from the Province. In 1816, for example, some 224,000 bushels of wheat were sent to Rio de Janeiro and 2,000 bushels to Santa Catarina. The value of these exports represented 30% of the total exports of the province (Saint-Hilaire, 1974: 79). But in his 1850 Report, the Provincial President of Rio Grande do Sul noted that “wheat, which was a thriving crop in the past, has been attacked by rust and has discouraged farmers [from growing it], and today there is little produced and only in few places, so that it is insufficient for local production and foreign flour [is now consumed everywhere]” (Andréa, 1850: 15). This explains why in the three year period from 1845-1849, wheat flour was the second most valuable import into Brazil, just after textiles (Comissão Encarregada da Revisão…, 1853: 11). Nevertheless, the majority of Brazilians did not consume wheat, and manioc or corn remained the primary source of flour for national consumers.
3. Brazil Becomes a Wheat Consumer and Government Market Intervention
In the third quarter of the 19th century, however, the arrival of Italian immigrants brought a significant increase in local wheat production and consumption. The Portuguese and Italians would be the leaders in creating a wheat milling and baking industry, particularly in São Paulo and Rio de Janeiro (Bartaburu, 2016: 96). Although Brazil primarily imported the grain and milled it in the country, it still could not totally satisfy local needs and had to import wheat flour as well. In 1910, for example, it imported close to half a million tons of wheat, of which a third was flour and two thirds were grains. Of this total Argentina supplied almost all the grains and 68% of the flour, with the United States accounting for another 26% of this processed input. In total these wheat products accounted for 36% of the food imported. Of the imported grain 97% went to the two states of Rio de Janeiro and São Paulo, which dominated milling capacity and had the highest rates of consumption. In turn these two states took in little imported wheat flour which went mostly to non-milling states (Ministério da Agricultura, Indústria e Comércio, 1908-12, vol. II: table II, 99; table XIII, 128; table IV, 130-31).
At the beginning of the 20th century agricultural research centers concentrating on improving wheat seeds and production were created by the state and national governments. Foreign researchers were hired, and cultivars adapted to Brazilian conditions were developed (Alves, 1991; Fernandes Filho, 1994: 52-6). From the 1930s on, more attention was given to the production chain and successive direct interventions in the market. Law 470 of 1937, for example, stipulated measures to intensify the cultivation of wheat, creating five new experimental stations, as well as numerous seed multiplication stations in the producing states. It also established rules for setting minimum milling quotas for domestic wheat. Later, other regulations stipulated the minimum national wheat quota as well as the minimum price to be paid to producers (Bartaburu, 2016: 90; Knight, 1971: 76-81), and a 1937 law created product standardization and inspection norms (Brum, Heck & Lemes, 2004).
In the period of the Second World War, supply problems led to intensified public intervention in order to protect national consumption. In the 1950s, agricultural cooperatives dedicated to the product were created and strengthened (Neto & Santos, 2017: 89-98; Knight, 1971: 74, 81). The creation of CREAI, Carteira de Crédito Agrícola e Industrial (Agricultural and Industrial Credit Portfolio) at the Banco do Brasil allowed for the expansion of credit for agriculture in general and wheat in particular and had an important effect on the production structure. Between 1958 and 1960 about half of the wheat-growing area, on the order of one million hectares, was financed by the state (Fernandes Filho, 1994: 95). CREAI’s operations did not require the land as collateral, farmers need only pledge future harvest, machinery and equipment, which made it possible for non-landowning producers to operate more intensively in agricultural production in general, including wheat (Fernandes Filho, 1994: 50; Ruckert, 1993).
The first reliable data on wheat production and its structure appear with the 1920 agricultural census. In that year, there were 53,000 farms producing wheat, cultivated on 136,000 hectares, obtaining a total production of 87,000 tons, basically concentrated in Rio Grande do Sul. In terms of production value, wheat represented less than 5% of the value of corn production and just 10% of the value of rice production. Even in Rio Grande do Sul, wheat accounted for only 6% of the gross value of agricultural production in the 1920s. The most representative products were corn (47%) and rice (11%), while beans and cassava were similar in percentage to wheat (Barden et al., 2001: 21).
TABLE 1
Farms producing wheat, area cultivated and production,
Brazil and principal state producers (area is in ha, and production in Tons)
Census 1920, 1950, 1960
| Brazil | Rio Grande do Sul | Paraná | Santa Catarina | São Paulo | Others | |
|---|---|---|---|---|---|---|
| Censo 1920 | ||||||
| Farms | 53,405 | |||||
| Area | 136,069 | |||||
| Production | 87,180 | 83,374 | 1,555 | 1,450 | 40 | 761 |
| Censo 1950 | ||||||
| Farms | 227,774 | 160,835 | 28,397 | 36,842 | 683 | 1,017 |
| Area | 514,399 | 370,926 | 54,554 | 81,703 | 4,033 | 3,183 |
| Production | 357,184 | 248,674 | 43,022 | 61,099 | 2,441 | 1,948 |
| Censo 1960 | ||||||
| Farms | 19,482 | 14,605 | 1,645 | 3,159 | 61 | 12 |
| Area | 1,359,880 | 1,165,888 | 59,419 | 103,469 | 29,804 | 1,300 |
| Production | 503,715 | 381,759 | 58,628 | 59,132 | 3,947 | 249 |
| Size | ||||||
| 1960 | 1-10 | 10-20 | 20-50 | 50-100 | 100-500 | 500+ |
| Farms | 3,557 | 4,696 | 6,442 | 2,272 | 2,077 | 438 |
| Area | 20,378 | 65,258 | 196,178 | 153,194 | 432,213 | 492,659 |
Source: IBGE, Estatísticas do Século xx, censos agrícolas 1920, 1950, 1960, https://seculoxx.ibge.gov.br.
In 1950 the number of wheat farms, their cultivated area and their production multiplied by four since 1920. Rio Grande do Sul continued to be the leading state producer, with about 70% of national production, but significant wheat farming was already identified in the other southern states of Paraná and Santa Catarina. In 1960, the area used for wheat cultivation reached 1.3 million hectares, with an output of 500,000 tons, again concentrated in these three southern states, and along with São Paulo which had once again returned to wheat production. In this census 75% of wheat farms were less than 50 hectares, but they controlled only one fifth of the cultivated area. Over two thirds of wheat cultivation took place on farms over 100 hectares (see Table 1).
Gradually the federal government increased the degree of its intervention in wheat production, an intervention which did not occur for any other products destined for the domestic market. With this support, there was a fivefold increase in average wheat production in the 1950s compared to the 1930s. But despite this increased production, imports continued to grow throughout this century, only interrupted by international wars, as wheat consumption spread to the increasingly urban population of Brazil. Traditionally Argentina was the main supplier of wheat to Brazil from early in the 19th century. Argentina represented one of the world’s major producers and benefited from its strategic location in relation to the Brazilian market. It also mostly exported grains to Brazil, and the expansion of the national milling industry meant that Brazil could produce all the flour needed from national and imported grains. This explains why as late as 1953 some 98% of the wheat imported was in grains and only 2% in flour (IBGE, 1955: 302).
4. United States Intervention in the Brazilian Wheat Market
The composition of Brazilian imports would be dramatically changed in 1954 with the new United States subsidization of wheat exports for developing countries, which occurred after the passage of Public Law 480 (PL 480). In the period after Second World War and the Korean War, the United States wheat producers faced a constant excess capacity which reached significant levels and depressed farm incomes. In 1954 US farm groups proposed that the government allow surplus wheat production to be purchased by foreign governments with their local nonconvertible currencies, thus saving their foreign exchange reserves as well as easing US grain surpluses. In turn these currencies could be used for development projects in the receiving countries. When it was at maximum activity, the PL 480 wheat program accounted for the majority of US foreign aid during the Cold War (USDA, 1970; Wilder, 1963; Reutlingler, 1983; Fernandes Filho, 1994, 123-44; Public Law 480: “Better Than a Bomber”). The extremely advantageous payment terms were a key attraction for countries to expand their grain purchases from the United States. The products were sold on a long-term basis with low interest rates and could be settled in local currency.
Several agreements were subsequently signed between Brazil and the United States. The first in 1955, fixed a term of forty years, indicated the cruzeiro as the basic payment currency, allowed a grace period of four years and variable interest rates between 3% and 5%. Subsequently other agreements were signed with new terms, but essentially preserving the possibility of payments in local currency3. In the case of Brazil, a large importer of wheat, the conditions of the program discouraged domestic production of the product, since the massive imports did not affect the balance of payments and shifted purchases from Argentina to the United States (Fernandes Filho, 1994, 129-32). Between 1961 and 1964 the United States accounted for 65% of Brazilian wheat imports, compared to 25% from Argentina, thus reversing the roles of these two traditional suppliers. As could be expected, these cheaper imports also reduced local wheat production. National production went from 28% of all wheat consumed in the 1957-60 period, to 21% in the following four-year period4. The flood of cheap US wheat imports in the period 1955 to 1967 also led to the substantial reduction of government subsidies to the local industry (Knight, 1971: 86).
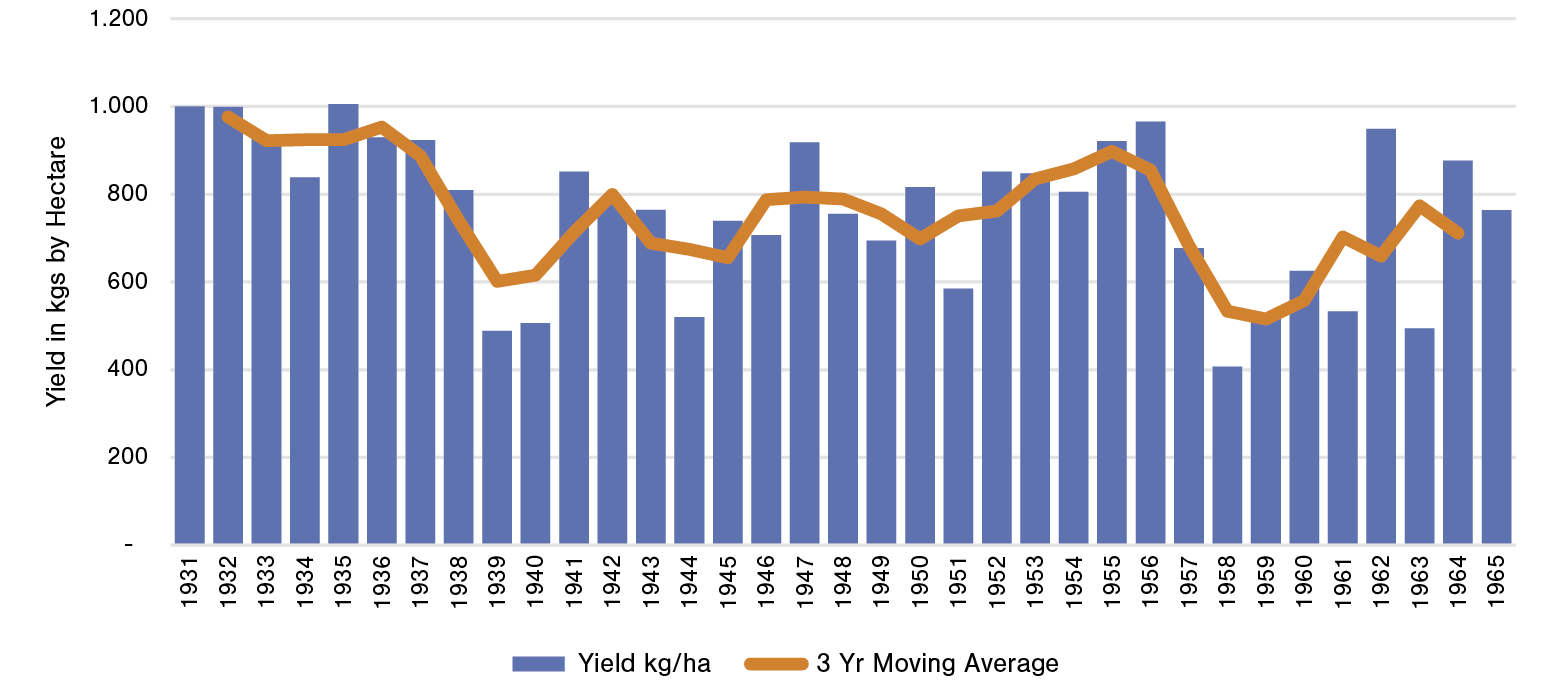
Not only were imports now increasing in importance in the national market, but all the pre-1964 government support for wheat production had not led to increased productivity as defined by output per hectare. Between 1930 and 1960 there was actually a decline in wheat output per hectare of land. Comparing the five-year periods 1931-35 and 1961-65, we find that the cultivated area multiplied by five and the production by only three. In other words, the growth in production occurred simultaneously with a decline in productivity, which led to increased imports (see Graph 1).
GRAPH 1
Average yield of wheat by hectare of Brazilian farmers, 1931-65
(trend shown by 3 year moving average)
Source: IBGE, Séries históricas.
For several years, the commercial agreements with the United States based on PL 480 were advantageous due to low interest rates, long payment terms, and most importantly, payment in national currency. However, after five successive agreements, which maintained similar rules, the sixth Wheat Agreement signed in April 1966 fundamentally changed the trade conditions, reducing the grace period to pay for the wheat and, most importantly, now requiring the wheat to be paid for in US dollars. The agreement also required that resources could not be used in the cultivation of agricultural products that Brazil exported in competition with the United States. In addition, the period of validity was reduced to twenty years and the grace period to one year5.
5. Post 1965 Government Control over the National Industry
These new conditions were far less attractive for Brazil, and the government again began to develop measures to stimulate domestic production, in order to reduce foreign dependence. But even before the signing of this new agreement there had been a reduction in US grain imports supported by PL 480. In 1965, imports of North American wheat declined to only 236,000 tons, compared to 1.5 million tons in the previous year. Moreover, the flour and grain composition of imports reverted back to traditional patterns and in that year 1.4 million tons of wheat grain was imported (IBGE, 1966: 197).
From 1965 on measures were taken to stimulate the national production and place the wheat market in the hands of the federal government. In 1965, Decree 56.4526, created the Department of Wheat (DTRIG), which now centralized all activities relating to wheat production and consumption in Brazil. The DTRIG was given the power to discipline and coordinate the commercialization of domestic wheat; promote imports of foreign wheat necessary to complement the country’s supply; fix and distribute wheat quotas to mills, according to the consumption needs of each region; grant and authorize the installation of new mills and the expansion of the milling capacity of existing ones.
The virtual monopoly of wheat operations in Brazil would be instituted by Decree-Law 210 in 1967. Control over wheat production, imports, industrial processing and marketing would be under direct control of the federal government. The decree also allowed for government imposition of import quotas which were established annually by the National Superintendence of Supply (SUNAB) and it was the government which purchased and sold this imported wheat. Domestic wheat would be purchased by the Federal Government through the Banco do Brasil as its financial agent according to commercialization norms established by SUNAB. It also made wheat transport an absolute priority of transportation in all federal, state and municipal areas to guarantee its fast outflow. SUNAB was granted the power to determine the mixture of wheat flour with any other bread-making flours. After establishing eight regional areas of consumption, the SUNAB established the quantities of wheat for the consuming zones and which mills would process this wheat. The concession for the installation of new mills or increases in the capacity of existing mills was prohibited. The Decree was extremely thorough in the operational procedures regarding storage or processing of wheat. It represented a true nationalization of the wheat production process, carried out through the private sector.
This draconian legislation was more part of basic policy under the new military rulers than a direct response to changes in US wheat exports programs. Their aim was to reduce the cost of food, through direct subsidies to the consumer; stimulating domestic production and reducing imports which were a heavy burden on the balance of payments. As the cost of domestic production was usually higher than the cost of imports, the government acted to reduce those costs. As the sole buyer of domestic and imported wheat, the government sold the wheat to the mills below their purchase costs and set prices at all stages of the production process. But the costs were high and so the government invested major sums to increase the productivity of domestic wheat.
Although wheat was the extreme case in terms of government intervention, other products were now regulated or controlled by federal agencies, such as the Sugar and Alcohol Institute (IAA), the Coffee Institute (IBC), and the Executive Commission of the Cocoa Farming Plan (CEPLAC). In addition, the government created a broad system of support for agriculture, through instruments such as the Policy of Guaranteeing Minimum Prices (PGPM), the policy of regulating stocks, through the Federal Government Acquisitions (AGF), the generous policy of agricultural credit and stimulus to agricultural research, centralized in the Brazilian Agricultural Research Corporation (Embrapa). These were instruments that benefited agriculture as a whole.
The military governments of the period implemented an aggressive agricultural policy, both for export products and for products destined for the domestic market. A policy of Minimum Prices and Regulating Stocks was implemented; a broad system of rural credit was administered, with abundant resources and negative real interest rates. Support was given to the acquisition of modern inputs such as fertilizers, insecticides and seeds, as well as agricultural machinery and equipment, which stimulated the modernization of production processes. Moreover agriculture now had the support of rural insurance, through the Proagro program created in 1973, which was particularly important for the wheat farmers. It was designed to exonerate the rural producer from financial obligations related to credit operations whose settlement was affected by the negative climate conditions. Although still limited and with changes over the years, it represented an important step in the set of agricultural instruments to support Brazilian agriculture (Ramos, 2009; Souza, 2020).The creation of Embrapa in 1972, which strengthened and centralized agricultural research, was also extremely important. There was also a policy of creating agricultural schools in all the newly created and expanding federal and state universities. This major financing of scientific research and agricultural education was designed to modernize agriculture and increase productivity in all sectors. The government’s objective was clear: provide cheap products to the population, expand agricultural exports and, in the special case of wheat, reduce imports.
The impact on these programs on wheat farmer income and on their production can be seen in the data. Between 1966 and 1989 the national production of wheat increased from 615,000 tons to 5.6 million tons, multiplying the production by 9 in the period (9.3% annual growth). In the same period the cultivated area multiplied by 4.6, which signified an increase in yield per hectare from 857 kg to 1,692 kg. For comparison, in the period from 1966 to 1990, two other domestic staples, rice and corn production grew at annual rates of just over 2%, and their productivity, as indicated by output per hectare, grew more slowly. Whereas in this period the production per hectare increased by 42% in the case of corn, 39% in the case of rice, it increased by 71% in the case of wheat. This heightened productivity resulted in a faster growth of wheat production compared to the expansion of land allocated for its cultivation (see Graph 2).
GRAPH 2
Wheat by area cultivated. Production and yield per hectare, 1961-95
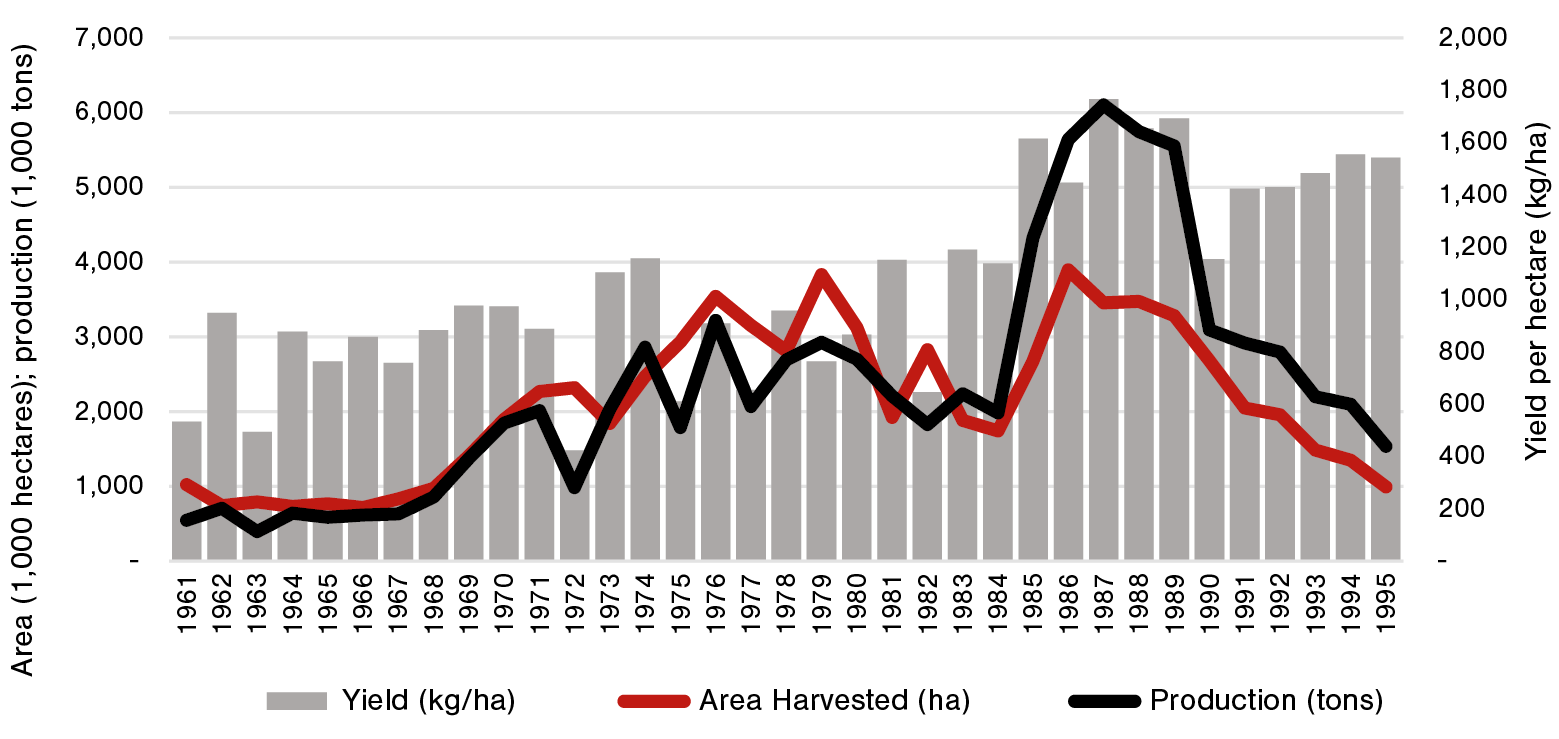
Source: FAOSTAT, https://www.fao.org/faostat/en/.
Along with the stimulus to production via credit, a broad system of subsidies to the consumer of wheat also operated. This occurred through the differential between the costs of the wheat bought by the government from domestic producers and importers, and the selling price to the mills, which was much lower than the total cost. If we consider the year of the greatest subsidy, 1980, the government bought the product at a total cost of US$ 234 per ton and sold it to the mills for US$ 44 per ton (Frausino, 1995: 48). This reduced the cost to the mills, and allowed the final product sold to the consumer to be extremely cheap, not only reducing the cost of the basic food basket, but affecting the relative prices of the economy and stimulating the consumption of wheat products, thus expanding domestic demand. If we compare the increase in consumption of wheat and rice, two staple products of the Brazilian population, we find a 47% increase in rice between 1966-68 and 1989-91, whereas wheat consumption increased 102% over the same period7. Per capita wheat consumption, which was 26 kg per person in 1965, reached 50 kg per person in 1991. Subsidized prices and rural to urban migration contributed to increase the consumption of wheat in Brazil, replacing such other cereals as corn or cassava (Fernandes Filho, 1994: 170)8.
The 1985 agricultural census allows us to appreciate the structure of wheat production that existed under the total government control of the market. In that year there were 142,000 wheat producers, with an area of 2.5 million hectares producing 3.8 million tons. The vast majority of producers owned their land, with about one-fifth renting and having other forms of access to land. Properties of less than 100 hectares represented more than 90% of the establishments, and just over half of the total area planted in wheat and half of total wheat production. Farms smaller than ten hectares constituted the largest number of farms, but contributed only a small percentage of final production and occupied a small area of cultivated lands. Crops produced on farms of less than 100 hectares provided two-thirds of the total wheat planted and produced. From the point of view of technical characteristics, 73% of the establishments with more than 90% of the production used purchased seeds; about 80% of the production was carried out on farms that used pesticides and fertilizers. Finally, the vast majority of the wheat produced was delivered to cooperatives, and only a small portion to intermediaries or directly to the mills (see Table 2).
Over the period of increased regulation, the number of mills declined from 386 in 1967 to 179 in 1987. The reduction affected mainly small mills located in the south of the country. The reduction occurred because many of the mills were unable to meet the legal requirements of SUNAB, especially in relation to storage capacity. By 1987, the 22 mills with milling capacity between 500 and 1200 tons accounted for 59% of all Brazilian milling capacity (Garcia, 1977: 42). The mills were concentrated in the wheat producing regions and port areas. Along with the reduction in mills, there was also a high concentration in the main economic groups working in the wheat sector in Brazil. The three largest millers in the 1970s were Bunge and Born, Macedo Dias and Grumar (ibid.: 45). As of 1987, the four largest groups held 45% of the registered milling capacity, and they were still led by Bunge y Born, which alone accounted for 23% of national wheat flour production.
TABLE 2
Indicators of the production of wheat
Agricultural census, 1985
| Farms | Quantity | Area | ||
|---|---|---|---|---|
| Total | 142,717 | 3,824,288 | 2,518,086 | |
| Condition of Farmer | ||||
| Owner | 82.07% | 81.59% | 80.40% | |
| Renter | 12.45% | 12.10% | 13.59% | |
| Other | 5.48% | 5.94% | 6.02% | |
| Farm Size | ||||
| Less | 16.90% | 3.05% | 3.06% | |
| 10-100 ha | 74.42% | 51.05% | 50.08% | |
| 100-1,000 ha | 8.14% | 40.14% | 40.67% | |
| 1,000-10,000 ha | 0.38% | 5.18% | 5.74% | |
| 10,000+ | 0.01% | 0.55% | 0.37% | |
| Area Cultivated | ||||
| Less than 10 ha | 60.60% | 9.96% | 11.47% | |
| 10-100 ha | 46.65% | 56.95% | 55.02% | |
| 100-500 ha | 2.95% | 28.54% | 28.63% | |
| 500+ | 0.10% | 4.55% | 4.88% | |
| Technical characteristics | ||||
| Uses | 26.68% | 7.00% | 10.00% | |
| Use | 73.00% | 93.00% | 90.00% | |
| Use defensives and | 45.00% | 86.00% | 77.00% | |
| Destination of the product | ||||
| Delivered | 85.19% | |||
| Delivered | 9.19% | |||
| Delivered | 4.28% |
Source: IBGE, Censo Agricola, No. 1, Brasil, 1985.
TABLE 3
Wheat prices in the productive chain in total value of subsidies (US$ per ton),
1967-89
| Year | National | Imported | Price | Average | Subsidy | Total | Price paid to | Total | Value | Total | Sold to | Cost (4) | per | Subsidy | the producer | Cost (1) | FOB | Cost (2) | Mills | ton | (US1000) |
|---|---|---|---|---|---|---|---|---|
| 1967 | 111.75 | 148.07 | 62.53 | 98.68 | 83.36 | 99.61 | 17.61 | 41,469.00 |
| 1968 | 103.15 | 132.00 | 57.96 | 93.63 | 77.48 | 97.12 | 19.54 | 56,641.76 |
| 1969 | 106.39 | 135.00 | 59.96 | 92.42 | 76.06 | 100.00 | 23.98 | 69,709.86 |
| 1970 | 102.62 | 131.37 | 60.78 | 97.93 | 87.81 | 108.55 | 21.00 | 63,693.00 |
| 1971 | 98.50 | 126.50 | 62.68 | 98.71 | 85.58 | 115.03 | 29.45 | 94,505.05 |
| 1972 | 98.56 | 126.50 | 78.70 | 116.47 | 85.57 | 122.64 | 37.07 | 125,185.39 |
| 1973 | 121.75 | 159.97 | 137.42 | 209.04 | 93.79 | 189.26 | 95.47 | 364,499.59 |
| 1974 | 194.42 | 242.86 | 192.72 | 268.30 | 105.18 | 222.64 | 117.46 | 483,465.36 |
| 1975 | 194.42 | 242.86 | 192.72 | 268.30 | 90.62 | 236.02 | 145.40 | 645,139.80 |
| 1976 | 181.64 | 227.75 | 132.70 | 201.27 | 72.56 | 219.14 | 146.58 | 742,281.12 |
| 1977 | 206.14 | 257.63 | 107.01 | 166.30 | 85.50 | 197.02 | 111.50 | 585,598.00 |
| 1978 | 212.19 | 263.89 | 125.32 | 184.84 | 79.72 | 205.07 | 125.35 | 697,667.60 |
| 1979 | 172.30 | 216.75 | 162.67 | 221.06 | 59.84 | 238.65 | 178.81 | 1,090,025.76 |
| 1980 | 197.34 | 246.34 | 184.64 | 241.92 | 43.81 | 234.11 | 190.30 | 1,226,400.60 |
| 1981 | 248.98 | 308.37 | 177.49 | 243.21 | 110.45 | 244.29 | 133.89 | 816,022.48 |
| 1982 | 272.75 | 333.11 | 169.12 | 232.57 | 135.86 | 253.02 | 177.16 | 707,060.60 |
| 1983 | 207.65 | 259.34 | 159.57 | 223.67 | 104.27 | 258.68 | 154.41 | 921,210.06 |
| 1984 | 228.49 | 284.17 | 149.65 | 213.67 | 107.08 | 226.51 | 119.43 | 763,515.99 |
| 1985 | 251.01 | 311.21 | 141.11 | 205.68 | 114.28 | 321.21 | 239.80 | 1,465,477.80 |
| 1986 | 237.89 | 295.28 | 87.09 | 154.89 | 77.98 | 219.01 | 141.03 | 1,017,954.54 |
| 1987 | 185.34 | 233.17 | 93.98 | 154.98 | 103.40 | 240.56 | 137.16 | 911,702.52 |
| 1988 | 183.78 | 231.33 | 104.14 | 177.15 | 191.36 | 240.23 | 48.64 | 310,274.56 |
| 1989 | 177.01 | 223.33 | 163.37 | 234.55 | 198.72 | 231.84 | 33.12 | 327,335.68 |
Notes: (1) includes freight, storare, ICM, BB commission; (2) includes freight, insurance, Cacex taxes, port taxes, and BB commission; (3) annual average; (4) average weighted by the quantities of domestic and imported wheat purchased.
Source: Frausino (1995: 48).
This wheat policy had an extraordinary fiscal cost, which exceeded more than a billion dollars in some years. For this reason, the end of this subsidy was already being discussed in the 1980s, as it was a major burden on these accounts and was singled out as a key cost to the government. It is estimated that the proportion of the Wheat Account in relation to GDP was increasing throughout the 1980s, reaching its maximum in 1985, when it represented 0.86 of GDP (Frausino, 1995: 49). Thus, even before 1990 the subsidies given to the mills were sharply readjusted, and went from $239 per ton in 1985 to only $33.12 per ton in 1989. The total subsidy to producers, millers and consumers that had reached $1.4 billion in 1985 was then reduced to $327 million in 1989 (see Graph 3 and Table 3).
GRAPH 3
Percentage of subsidy by ton and total cost of subsidy, 1967-89
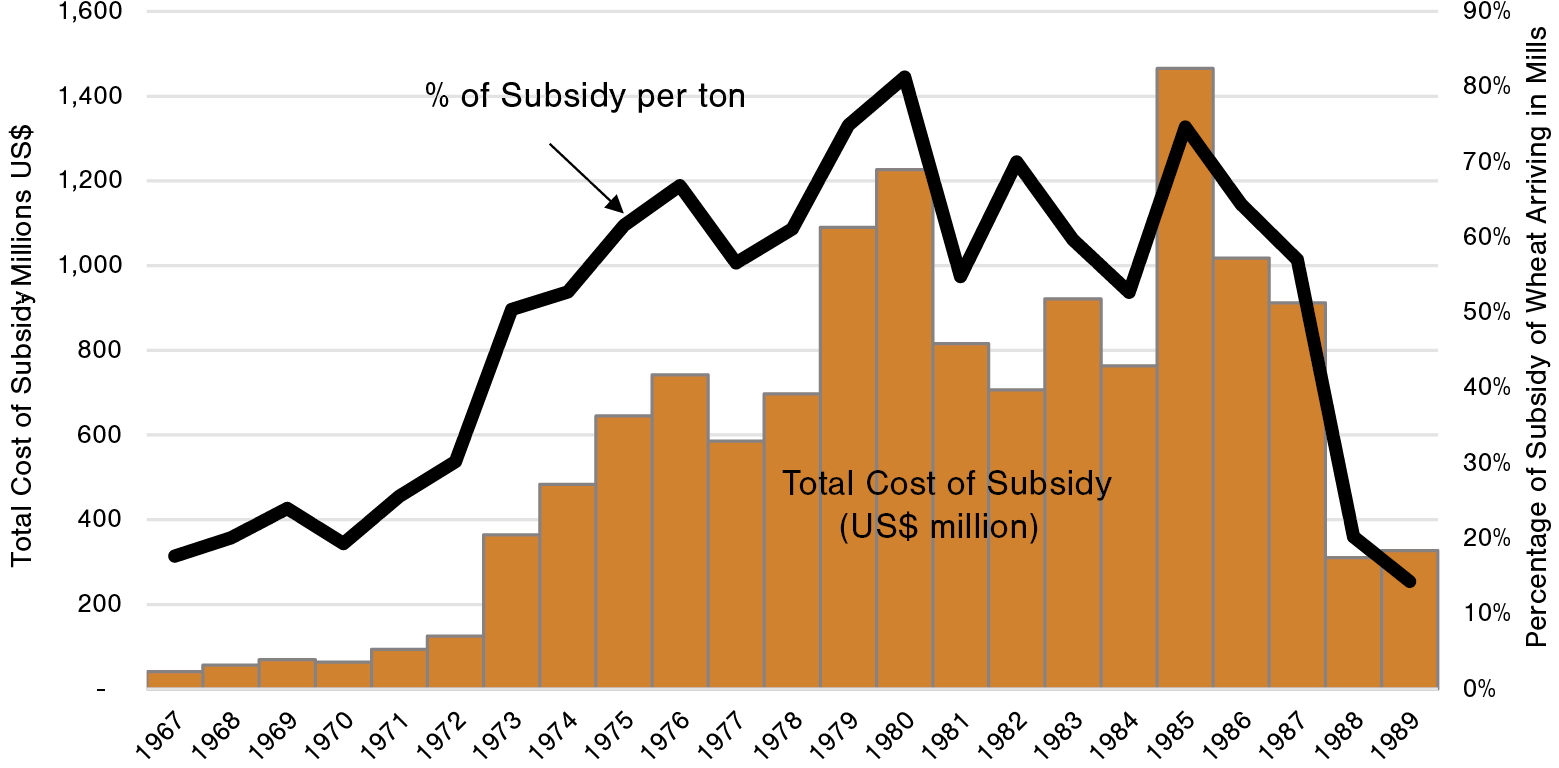
Source: Frausino (1995).
6. End of Government Subsidization of Wheat Production
In 1990, under the new neo-liberal civilian government and as part of a response to international lenders to reduce its public accounts, there was a major opening of the Brazilian market to world trade. Provisional Measure 224 of that year, declared the national wheat market to be open to world markets, along with all other agricultural products. This led to a significant reduction in the level of government agricultural subsidies, but the traditional instruments of support to the sector were maintained, such as rural credit, rural insurance and minimum price policy.
With the enactment of Provisional Measure 224, the national wheat market was freed from all constraints. Farmers were now allowed to sell their wheat and millers to produce their flour without government regulation. Starting in the mid-1980s rural loans began to be adjusted by monetary correction; as a result, the cost of credit became positive and gradually increased until it was equal to other market rates (Klein & Luna, 2019: 43; Bacha, Danelon & Bel Filho, 2006; Ramos & Martha Junior, 2010). After 1990 a large part of the credit was now at market prices, and now came mostly from private sources. Also all taxes on wheat imports ended.
The first response of the market was quite negative as the wheat farmers were unprepared to compete freely with imports. Moreover, the constitution of the Southern Common Market (Mercosur), with the objective of commercially integrating the southern cone countries (Brazil, Argentina, Uruguay, Paraguay), created a competitive situation with Argentina, traditionally one of the main producers and exporters of wheat in the world, which supplied most of the wheat imported by Brazil. The immediate consequence was the decline in national production and a significant increase in imports.
Thus, the national production that had reached an annual average of 5.2 million tons in the period 1986-90 was reduced to 2.3 million tons in the following five years (1991-95). Imports, which in the first period averaged 1.8 million tons, increased to 5.4 million tons. The country that had almost reached self-sufficiency in 1988, producing 85% of apparent consumption, began to depend more and more on imported wheat. By the year 2000, the national share of apparent consumption had fallen to about 20% (FAOSTAT). In that year Brazil imported 7.1 million tons of wheat from Argentina (COMEX).
The wheat sector thus faced a serious crisis in the 1990s, but like the other agricultural producers they gradually found alternatives, utilizing new financial instruments created in the period. These included among others the Rural Savings Account created by the federal government from 1980 which allowed private capital to provide credit. Also through the Rural Producer Note (CPR), and the Agribusiness Letter of Credit (LCA), producers were able to support international operations and obtain hedging instruments which allowed financial institutions to raise funds to finance agribusiness. Another factor was the government’s decision to index loans to the price of financed products on instruments currently available in the market. Financing and product prices indexed in the same way reduced the risk of the producer (Vian, 2019).
There was also a better integration between agriculture and its value chains, with suppliers, product processors, and the commercialization structure. This involved both dealing with supermarkets in the domestic market and with the large trading companies and other market operators internationally. The Plano Real, implemented in 1994, which eliminated the very high levels of inflation, allowed the functionality of such credit instruments and greater predictability of agriculture, which operated within long production processes.
7. Wheat in an Open Market
Slowly, production revived in the early years of the 21st century, and by the time of the 2017 Agricultural Census there were 35,000 wheat-growing farms producing 4.7 million tons on 1.8 million hectares. As in earlier censuses, the concentration of production was in establishments between 100 and 1000 hectares, which generated about half of production. The emergence of large establishments exceeding 1000 hectares, constituting 28% of production, marks a significant shift for Brazil, transitioning from the small farm model seen in early Canadian wheat production to the Argentine model characterized from the beginning by large-scale wheat farm producing units (Adelman, 1994). In 2017, the average area of wheat-producing establishments was 50 hectares and the average production was 132 tons. The vast majority of producers used certified seeds and only 12% used their own seeds. Finally, a significant contingent of family farmers was producing wheat. They represented one-third of the establishments with an average production of 38 tons, against 300 tons of non-family producers. Their average total area was 16 hectares, compared to 112 hectares for the non-family farms. Since the census of 1985, production per hectare increased from 1,518 to 2,618; the average production per establishment increased from 27 tons to 132 tons (Table 4).
TABLE 4
Indicators of wheat production
Agricultural census, 2017
| Farms | Quantity (tons) | Area | ||
|---|---|---|---|---|
| Total | 35,268 | 4,681,069 | 1,788,027 | |
| Condition of Farmer | ||||
| Owner | 31,347 | 4,185,492 | 1,584,692 | |
| Renter | 2,698 | 395,154 | 166,519 | |
| Other | 1,223 | 100,423 | 36,816 | |
| Farm Size (hectares) | 35,261 | 1,787,545 | ||
| Less | 2,936 | 30,605 | 13,422 | |
| 10-100 ha | 22,535 | 1,055,817 | 438,194 | |
| 100-1,000 ha | 8,729 | 2,260,638 | 876,739 | |
| 1,000-10,000 ha | 1,053 | 1,292,701 | 445,901 | |
| 10,000+ | 8 | 39,814 | 13,289 | |
| Size of Cultivated Area | ||||
| Less | 9,237 | 121,301 | 51,217 | |
| 10-100 ha | 21,863 | 1,688,094 | 680,334 | |
| 100-500 ha | 3,757 | 1,932,128 | 722,333 | |
| 500+ ha | 411 | 939,546 | 334,143 | |
| Use of seeds | ||||
| Own | 4,329 | 718,163 | 282,253 | |
| Common | 5,209 | 717,347 | 283,475 | |
| Certified | 25,730 | 3,245,558 | 1,222,299 | |
| Farmer characteristic | ||||
| Non- | 12,755 | 3,819,085 | 1,428,573 | |
| Family | 22,513 | 861,984 | 359,453 |
Source: IBGE, Censo Agricola, 2017.
Along with increasing production and productivity was the incorporation of new areas of production beyond the traditional southern states. Embrapa, especially since the mid-1970s, was crucial in this development, as in so many of the changes in modern Brazilian agriculture. These factors explain the recent exceptional growth in wheat productivity which has now reached international levels. Average production of wheat per hectare, was 1,850 kg in the 1980s, then increased to 2,200 kg in the 1990s, 2,460 kg in the 2000s, and finally to 3,000 kg in the 2010s. This is thanks to the adaptation of new technologies, cultural practices, inputs and seeds to Brazil’s natural conditions. Since the opening of the economy in 1990 the average output per hectare has increased by more than 60%. The productivity performance of Brazilian wheat (as measured by output per hectare) can be better evaluated by comparing the national production per hectare to Argentina and the United States. In the early 1960s, before the impact of measures to intensify domestic production of wheat, yield per hectare of wheat in Brazil was only 60% of the yield per hectare of Argentina and 45% of that of the United States. In the 1990s these percentages were 73% and 55%, respectively, but in the current decade Brazil has reached parity in terms of yield per hectare with these two countries (see Graph 4).
GRAPH 4
Wheat yield of the USA, Argentina and Brazil, 1960/61-2022/23
(in metric tons per hectare)
ç
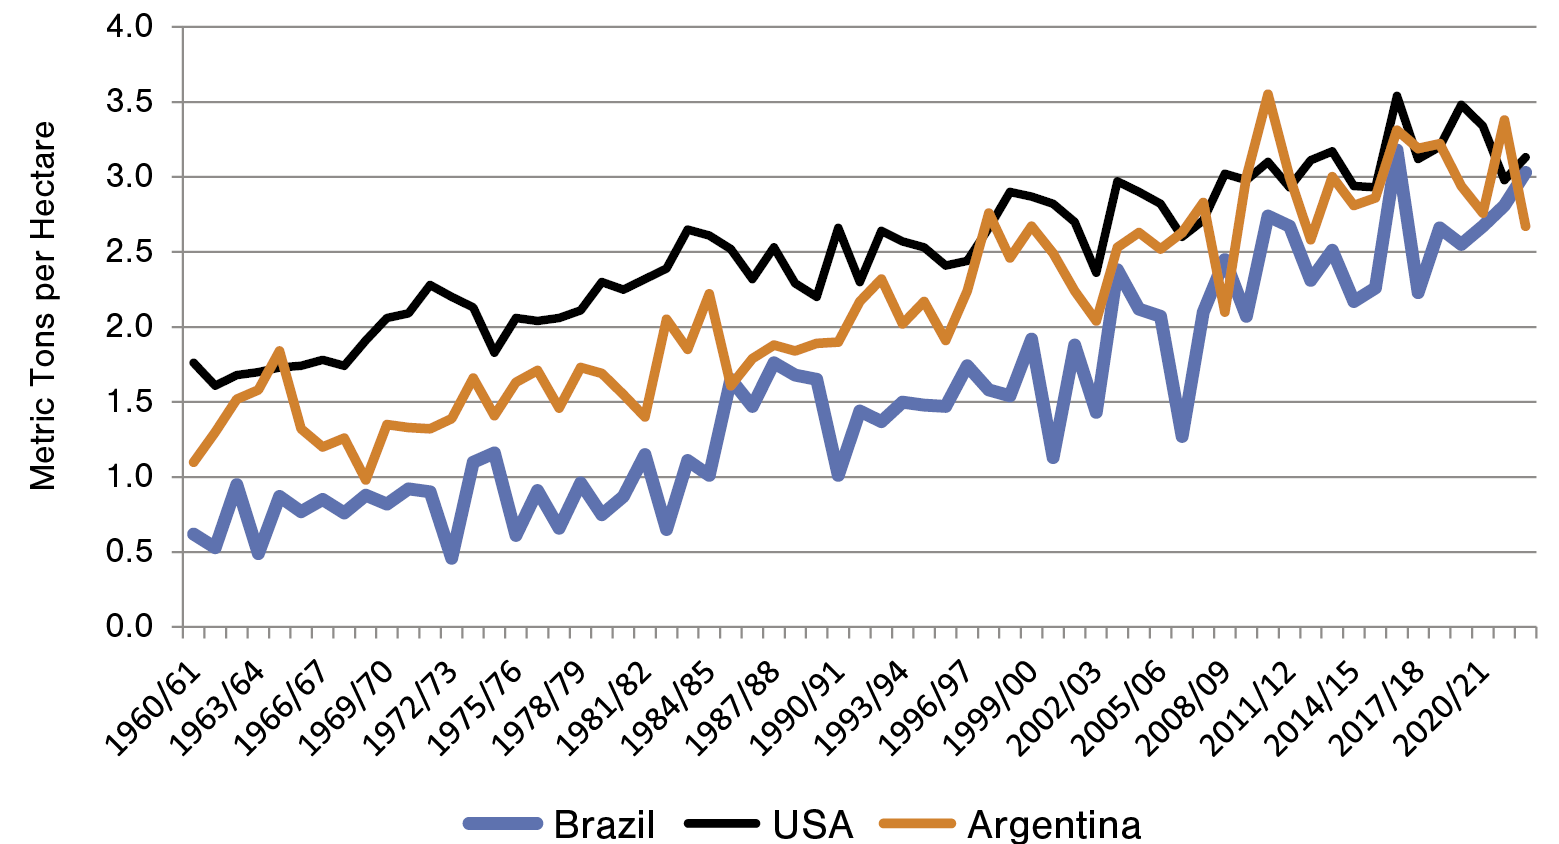
Source: United States Department of Agriculture (USDA), Foreign Agricultural Service, PS&D, https://apps.fas.usda.gov/psdonline/app/index.html#/app/advQuery.
On the basis of the research of Embrapa and other centers, there has been better use of soils, along with the availability of new inputs, especially seeds suitable for the conditions of the various regions of the country. Crucially, this allowed the opening of the previously unproductive tropical Cerrado region, which has now become the largest producer of grains in the country, and has now even begun to produce wheat. By 2019, a century of genetic improvement of wheat in Brazil was completed, and in this period more than 500 wheat cultivars were made available to farmers in all regions of the country, from the traditional ones in the southern states to the irrigated and rainfed farms in tropical Central Brazil (Souza & Caierão, 2014: 7). Embrapa’s wheat genetics research led to the creation of 125 wheat cultivars for the most different types of use, from the manufacture of bread, pasta, cookies and crackers, to animal feed. Embrapa also developed a basic germplasm bank for the various improvement programs underway in the country. Thus, of every ten cultivars on the market, seven rely on Embrapa Germplasm (Embrapa, 2022: 72). Although Embrapa continues to be the largest holder of cultivars suitable for use in the country, in recent years several other institutions have developed varieties adapted to various regions or with characteristics desired by the industrial and livestock sectors (Souza & Vieira Filho, 2020: 15).
The southern states, particularly Paraná and Rio Grande do Sul, still overwhelmingly dominate national wheat production (see Graph 5). Nevertheless Bahia, Mato Grosso do Sul and Goiás have begun producing wheat. Although they account for just 4% of national production in the crop year of 2023, their output has been growing and they are expected to have a significant growth in the coming years, thanks to the results of Embrapa research (see Map 1).
GRAPH 5
Wheat production by region and nation, 1977-2023
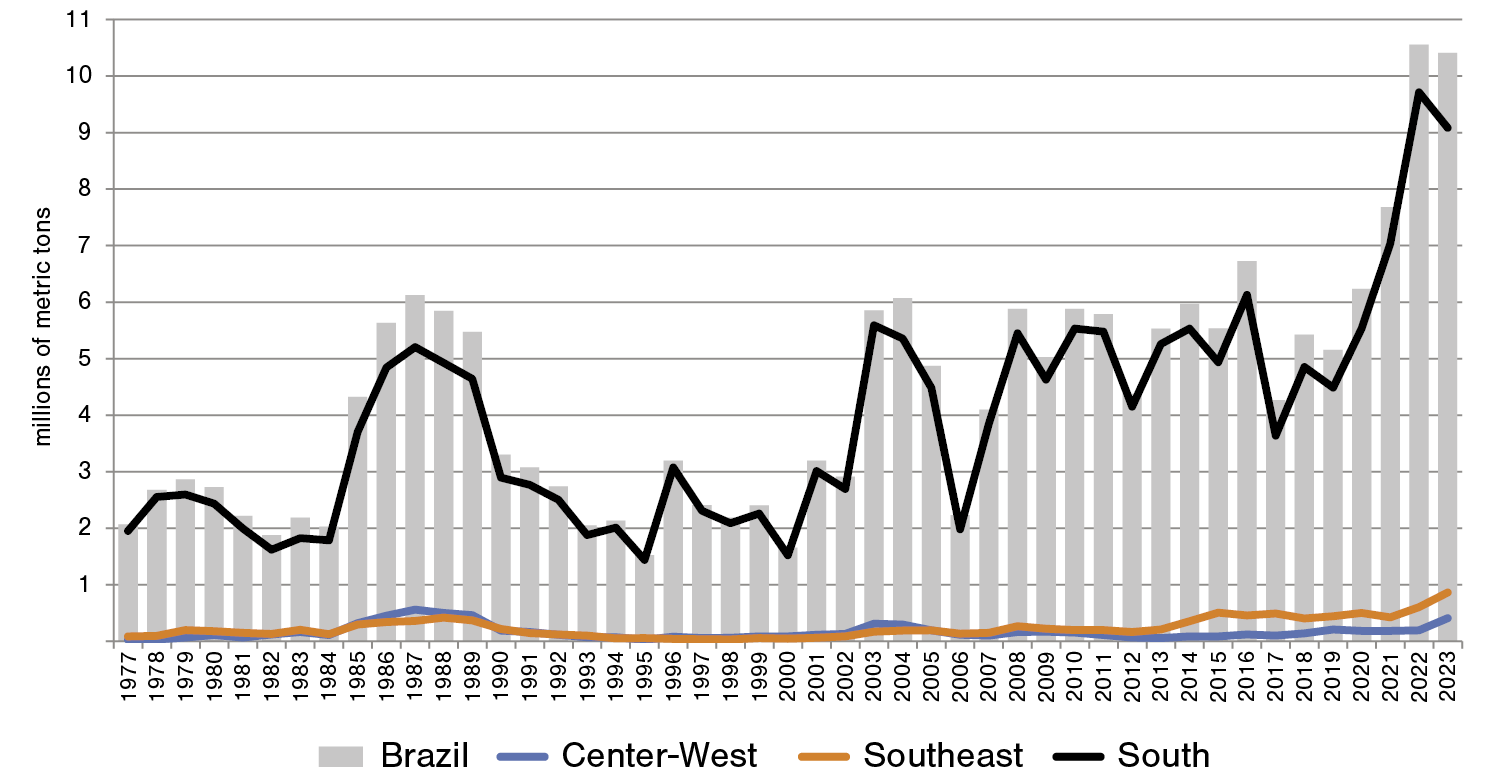
Source: CONAB, Trigo Serie Historico, https://www.conab.gov.br/info-agro/safras/serie-historica-das-safras/itemlist/category/913-trigo.
MAP 1
Production of wheat by Mesoregion in 2020 (in metric tons)

Source: IBGE, Bases Cartográficas Sidra, table 1612.
TABLE 5
Apparent consumption of wheat in Brazil, 2011/12 to 2022/23 (units are in 1000 tons)
| Crop | Initial | Production | Imports | Supply | Exports | Internal | Final Stock | |
|---|---|---|---|---|---|---|---|---|
| 2011/12 | 5,789 | 6,012 | 1,901 | 10,145 | ||||
| 2012/13 | 4,380 | 7,010 | 1,684 | 10,134 | ||||
| 2013/14 | 5,528 | 6,642 | 47 | 11,382 | ||||
| 2014/15 | 2,141 | 5,971 | 5,329 | 13,714 | 1,681 | 10,652 | 1,381 | |
| 2015/16 | 1,381 | 5,535 | 5,518 | 12,434 | 1,051 | 10,313 | 1,071 | |
| 2016/17 | 1,071 | 6,727 | 7,089 | 14,886 | 577 | 11,471 | 2,839 | |
| 2017/18 | 2,839 | 4,262 | 6,388 | 13,488 | 206 | 11,245 | 2,038 | |
| 2018/19 | 2,037 | 5,428 | 6,739 | 14,204 | 583 | 11,361 | 2,260 | |
| 2019/20 | 2,260 | 5,155 | 6,677 | 14,091 | 342 | 11,961 | 1,788 | |
| 2020/21 | 1,788 | 6,235 | 6,008 | 14,031 | 823 | 11,899 | 1,309 | |
| 2021/22 | 1,911 | 7,700 | 6,392 | 16,003 | 3,070 | 11,750 | 1,183 | |
| 2022/23 | 2,133 | 10,300 | 5,600 | 18,033 | 3,500 | 12,100 | 2,433 |
Source: SUNAB, Análises mensais, various months and years; for the last two years, USDA, Foreign Agricultural Service, PS&D, https://apps.fas.usda.gov/psdonline/app/index.html#/app/advQuery.
Despite this significant growth in domestic production of wheat, the country still depends on imports to meet the apparent domestic consumption of just over 11 million tons in the five years previous to 2022/23. Although Brazil still depends on an average of some 6 million tons (or over half of its total consumption in the past five years) to supply its domestic market, it has taken advantage of export opportunities. As production is concentrated in a few months of the year and consumption occurs throughout the year, Brazil now exports part of its production, with exports reaching 3.5 million tons by 2022/23 (Table 5).
It is only in the last few decades that Brazil has become active in the international wheat market as a serious exporter, for the first time in its history. By the year 2023 it was estimated that Brazil had become the world’s 15th largest producer of wheat, with 10.35 million tons, just behind the 17.5 million tons produced by Argentina. It was the world’s 10th largest importer of wheat, importing 3.5 million tons. At the same time, it was also the 9th largest world exporter of wheat, sending 3.5 million tons into the international market. In terms of the international wheat market, the largest producers in 2022/23 were China, the European Union, India and the Russian Federation followed by the Anglo-Saxon countries. China, Egypt, and Indonesia, are the leading wheat importers, and the Russian Federation, the European Union, the English-speaking countries, Argentina and the Ukraine are currently the leading exporters. What is impressive is that some of the biggest producers and exporters are also major importers of wheat, such as China, the European Union and Turkey. Thus, Brazil is not unique in being both a significant importer and exporter of wheat (see Table 6).
TABLE 6
Principle countries in the international wheat market, 2022-23
(estimate of 8/2023)
| Largest Producers | Largest Exporters | Largest Importers | Rank | Country | Production (1000 tons) | Country | Exports (1000 tons) | Country | Imports (1000 tons) |
|---|---|---|---|---|---|---|
| 1 | China | 137,000 | Russian | 48,000 | China | 12,000 |
| 2 | European | 135,000 | European | 38,500 | Egypt | 12,000 |
| 3 | India | 113,500 | Canada | 24,500 | Indonesia | 10,500 |
| 4 | Russian | 85,000 | Australia | 21,500 | Turkey | 9,500 |
| 5 | United | 47,197 | United | 19,051 | Algeria | 8,700 |
| 6 | Canada | 33,000 | Argentina | 12,000 | European | 7,000 |
| 7 | Australia | 29,000 | Ukraine | 10,500 | Morocco | 7,000 |
| 8 | Pakistan | 28,000 | Kazakhstan | 7,500 | Philippines | 6,500 |
| 9 | Ukraine | 21,000 | Brazil | 3,500 | Bangladesh | 5,800 |
| 10 | Turkey | 19,500 | United | 1,900 | Brazil | 5,600 |
| 11 | Argentina | 17,500 | Serbia | 1,500 | Japan | 5,600 |
| 12 | United | 15,500 | Uzbekistan | 1,500 | Mexico | 5,400 |
| 13 | Kazakhstan | 15,000 | India | 1,000 | Nigeria | 5,300 |
| 14 | Iran | 14,000 | China | 900 | Saudia | 4,900 |
| 15 | Brazil | 10,300 | Mexico | 900 | Iran | 4,500 |
Source: USDA, Foreign Agricultural Service, IPAD, https://ipad.fas.usda.gov/cropexplorer/cropview/Default.aspx.
8. Conclusion
The evolution of Brazilian wheat production traces a unique and intricate history within a semi-tropical and tropical region. Wheat held minor significance in the national diet until the late 19th century, when millions of Southern Europeans migrated, transforming it into a staple. The burgeoning urban population led to a surge in national consumption, surpassing the capacity of domestic producers. Consequently, wheat became the predominant agricultural import for over a century, prompting costly government interventions in the late 20th century to subsidize national consumption. Despite the high costs, these interventions failed to yield significant productivity improvements.
The opening of the wheat market to competition and the cessation of subsidies in the last decade of the century initially seemed detrimental to national producers. However, investments in modern agricultural practices since the 1960s began to show results. The impact was not only felt in traditional southern states, but also in the tropical Center-West, where wheat, intercropped with corn and soybeans, emerged as a new source of production. With the market liberalization, wheat farmers adopted efficient and productive practices, utilizing advanced seeds and farming techniques, achieving yields on par with the United States and surpassing Argentina.
Given the rapid growth of crops like soybeans and corn, especially in previously non-producing areas like the Center-West region, the expectation is for continued growth in wheat production. A 1996 Embrapa study suggested the potential for a million and a half hectares in the Cerrado to produce irrigated wheat, albeit constrained by limited water availability during the wheat-growing season (Cánovas & Silva, 2000; Pereira, Cunha & Moresco, 2019). Future production growth hinges on the development of new seeds, international market conditions, local climate factors, and the competitiveness of domestic production.
The Brazilian agricultural revolution of the past half-century has finally embraced the one basic crop that eluded earlier efforts. Brazil is now on the verge of self-sufficiency in wheat production and has even developed export capacity. This remarkable journey involved the active participation of the state, public research institutions, and private entrepreneurs. Against a backdrop of unprecedented population growth and a shift from manioc to wheat consumption, Brazil has transitioned from centuries of dependence on imports to achieving success in satisfying its internal market, reducing reliance on imports, and emerging as a significant wheat exporter.
ACKNOWLEDGEMENTS
The authors would like to thank the anonymous reviewers of Historia Agraria for their helpful comments.
RESOURCES
Adelman, Jeremy (1994). Frontier Development: Land, Labour, and Capital on the Wheatlands of Argentina and Canada, 1890-1914. Oxford: Clarendon Press.
Alves, Isabel Tereza Gama (1991). Aspectos da evolução da produção e da pesquisa em trigo no Brasil. PhD thesis. Campinas: Universidade Estadual de Campinas.
Andréa, Francisco José de Souza Soares de (1850). Relatório do Estado da Província do Rio Grande de S. Pedro. Apresentado ao Exmo. Sr. Conselheiro José Antonio Pimenta Bueno, pelo Tenente General Francisco José de Souza Soares de Andréa. Rio de Janeiro: Typographia Universal de Laemmert. http://memoria.bn.br/pdf/252263/per252263_1850_00001.pdf
Bacha, Carlos José Caetano, Danelon, Leonardo & Bel Filho, Egmar del (2006). Evolução da taxa de juros real do crédito rural no Brasil: Período de 1985 a 2002. Teoria e Evidência Econômica, 14 (26), 43-69.
Barden, Júlia E., Silva, Darkei F. da, Ahlert, Lucildo & Wiebusch, Fernanda C. (2001). A economia do Rio Grande do Sul no período entre 1920 e 1940: Uma análise da região do Vale do Taquari. Estudos e Debate, (8), 7-55.
Bartaburu, Xavier (2016). Do grão ao pão: Farinha de trigo: História da moagem no Brasil. São Paulo: Abitrigo/Origem.
Brum, Argemiro Luís, Heck, Cláudia Regina & Lemes, Cristiano da Luz (2004). As políticas brasileiras de fomento à cultura do trigo: Uma revisão histórica. Desenvolvimento em questão, 2 (3), 95-117. https://doi.org/10.21527/2237-6453.2004.3.95-117
Cánovas, Abelardo Dias & Silva, Osmira Fatima da (2000). Aspectos econômicos da cultura do trigo em Goiás. Safra: Revista do Agronegócio, 1( 2), 22-4.
Carmo, A. Gomes (1911). O problema nacional da produção do trigo. Rio de Janeiro: Divulgador Brasileiro.
Collins, Edward J. T. (1993). Why Wheat?: Choice of Food Grains in Europe in the Nineteenth and Twentieth Centuries. Journal of European Economic History, 22 (1), 7-38.
Clement, Charles R., Cristo-Araújo, Michelly de, Coppens D’Eeckenbrugge, Geo, Alves Pereira, Alessandro & Picanço-Rodrigues, Doriane (2010). Origin and Domestication of Native Amazonian Crops. Diversity, 2 (1), 72-106. https://doi.org/10.3390/d2010072
Comissão Encarregada da Revisão da Tarifa das Alfandegas do Império, Brasil (1853). Documentos estatísticos sobre o comercio do Imperio do Brasil nos anos de 1845-1849. Rio de Janeiro: Typographia Nacional.
Conselho Nacional de Estatística (IBGE) (1955). Anuário Estatístico do Brasil. Rio do Janeiro: Serviço Gráfico do IBGE. https://biblioteca.ibge.gov.br/visualizacao/periodicos/20/aeb_1955.pdf
Conselho Nacional de Estatística (IBGE) (1966). Anuário Estatístico do Brasil. Rio do Janeiro: Serviço Gráfico do IBGE. https://biblioteca.ibge.gov.br/visualizacao/periodicos/20/aeb_1966.pdf
Embrapa (2022). Embrapa em números. Brasília: Embrapa.
Fernandes Filho, José Flores (1994). Análise da Política Brasileira de Fomento à produção de trigo, 1930/1990. PhD thesis. São Paulo: FGV/EAESP.
Flandrin, Jean-Louis & Montenari, Massimo (1998). História da alimentação. São Paulo: Estação Liberdade.
Frausino, Carlos Cesar Marques (1995). Mudanças Institucionais e a Indústria do Trigo (1987-1993). MA thesis. Campinas: Universidade Estadual de Campinas.
Garcia, Luís Alberto Ferreira (1977). A Organização Industrial da Moagem de trigo no Brasil. MA thesis. Piracicaba: Escola Superior de Agricultura “Luiz de Queiroz” da Universidade de São Paulo.
Holanda, Sérgio Buarque de (1995). Caminhos e Fronteiras. São Paulo: Companhia das Letras.
Jacobson, Luiz Ataides (2003). O trigo. Porto Alegre: Emater/Ascar/Governo Rio Grande do Sul.
Klein, Herbert S. & Luna, Francisco Vidal (2019). Feeding the World: Brazil´s Transformation into a Modern Agricultural Economy. Cambridge: Cambridge University Press.
Klein, Herbert S. & Luna, Francisco Vidal (2023). Brazilian Crops in the Global Market: The Emergence of Brazil as a World Agribusiness Exporter Since 1950. London: Palgrave MacMillan.
Knight, Peter T. (1971). Substituição de importações na agricultura brasileira: A produção de trigo no Rio Grande do Sul. Estudos Econômicos, 1 (3), 71-101.
Marchetti, Fábio, Massaro Jr, Luiz Roberto, Mello Amorozo, Maria Christina de & Butturi-Gomes, Davi (2013). Maintenance of Manioc Diversity by Traditional Farmers in the State of Mato Grosso, Brazil: A 20-Year Comparison. Economic Botany, 67 (4), 313-323. https://doi.org/10.1007/s12231-013-9246-3
Ministério da Agricultura, Indústria e Comércio (1908-12). Anuário Estatístico do Brasil. Vol. II. Rio de Janeiro: Typographia da Estatistica. https://biblioteca.ibge.gov.br/visualizacao/periodicos/20/aeb_1908_1912_v2.pdf
Ministério do Desenvolvimento, Indústria, Comércio e Serviço (MDIC), Secretaria de Comércio Exterior (2023). https://balanca.economia.gov.br/balanca/publicacoes_dados_consolidados/pg.html#s%C3%A9ries-hist%C3%B3ricas-detalhadas
Monteiro, John (1994). Negros da terra. São Paulo: Companhia das Letras.
Neto, Aroldo Antonio de Oliveira & Santos, Candice Mello Romero (Eds.) (2017). A cultura do trigo. Brasília: Conab.
Pereira, Jorge Fernando, Cunha, Gilberto Rocca da & Moresco, Edina Regina (2019). Improved Drought Tolerance in Wheat is required to unlock the Production Potential of the Brazilian Cerrado. Crop Breeding and Applied Biotechnology, (19), 217-25. https://doi.org/10.1590/1984-70332019v19n2r30
Public Law 480: “Better Than a Bomber”. Middle East Research and Information Project, 145 (march/Abril 1987). https://merip.org/1987/03/public-law-480-better-than-a-bomber/
Ramos, Rejane Cecilia (2009). O Seguro Rural no Brasil: Origem, evolução e proposição para aperfeiçoamento. Informações Econômicas, 39 (3), 5-16.
Ramos, Simone Yuri & Martha Junior, Geraldo Bueno (2010). Evolução da Política de Crédito Rural Brasileira. Planaltina: Embrapa Cerrados.
Reutlingler, Shlomo (1983). More Effective Aid to the World’s Poor and Hungry: A Fresh Look at United States Public Law 480, Title II Food Aid. Agriculture and Rural Development Department, World Bank, Discussion Paper, Report ARU8.
Ruckert, Aldomar A. (1993). Arrendamento capitalista na agricultura de trigo-soja no centro-norte do Rio Grande do Sul. Teoria e Evidência Econômica, 1 (2), 65-106.
Saint-Hilaire, Auguste de (1974). Viagem ao Rio Grande do Sul. Belo Horizonte: Itatiaia.
Silva, Maria Martins da (1992). A regulação do mercado brasileiro do trigo. São Paulo: Edusp/Fapesp.
Silva, Vera Martins da (1989). Subsídios de preços à produção e consumo de rigo no Brasil. Análise Econômica, 7 (11), 91-113.
Silva, Vera Martins da (1991). A distribuição de Benefícios pela Regulação Estatal: O Caso do Mercado Brasileiro de Trigo. Estudos Econômicos, 21 (1), 105-36.
Souza, Amanda de M., Pereira, Rosangela A., Yokoo, Edna M., Levy, Renata B. & Sichieri, Rosely (2013). Most Consumed Foods in Brazil: National Dietary Survey 2008-2009. Revista de Saude Publica, (47), 190-99. https://doi.org/10.1590/s0034-89102013000700005
Souza, Cantídio Nicolau Alves de & Caierão, Eduardo (2017). Cultivares de trigo indicadas para o cultivo no Brasil e instituições criadoras, 1922 a 2014. Brasília: Embrapa.
Souza, Rodrigo Gomes de (2020). Políticas de crédito, seguro e preços mínimos na triticultura brasileira. Brasília: IPEA. (Texto para Discussão, 2613).
Souza, Rodrigo Gomes de & Vieira Filho, José Eustáquio Ribeiro (2020). Produção de trigo no Brasil: Indicadores regionais e políticas públicas. Brasília: IPEA. (Textos para Discussão, 2608).
United States Department of Agriculture (USDA) (1970). Foreign Agricultural Economic Report, (65).
Varela, Alfredo (1933). História da Grande Revolução. 6 vols. Porto Alegre: Livrarias do Globo.
Vian, Ademiro (2019). Manual operacional dos títulos do agronegócio. Curitiba: Sistema Ocepar/OCB.
Wilder, Ronald P. (1963). An Analysis of some Aspects of Public Law 480. PhD thesis. Houston: Rice University.
↩︎ . Comexstat, http://comexstat.mdic.gov.br/en/comex-vis.
↩︎ . USDA Wheat Explorer, https://ipad.fas.usda.gov/cropexplorer/cropview/commodityView.aspx?cropid=0410000.
↩︎ . Plinio de Abreu Ramos, «Acordo do trigo», https://www18.fgv.br/cpdoc/acervo/dicionarios/verbete-tematico/acordos-do-trigo.
↩︎ . IBGE, Estatísticas do Século xx, https://seculoxx.ibge.gov.br.
↩︎ . Plinio de Abreu Ramos, «Acordo do trigo», https://www18.fgv.br/cpdoc/acervo/dicionarios/verbete-tematico/acordos-do-trigo.
↩︎ . Presidência da República, https://www.planalto.gov.br/ccivil_03/decreto/1950-1969/d56452.htm.
↩︎ . We estimate domestic consumption by the sum of domestic production plus imports and minus exports.
↩︎ . On the distributional impacts of the subsidy policy, see the essays of Silva (1989, 1991) and Garcia (1977: 37-9). On debates about which agents were really benefited by the consumption subsidy policy and its benefits to consumers, see Silva (1992: chap. 5).